Successful sales teams are not only highly disciplined in their sales metrics and reporting, but they also partner with sales operations to strategically design and use their key performance indicators (KPIs) to maximize efficiency and revenue. In this practical guide, we’ll cover the everyday metrics that sales professionals need to know, and how they can use these sales metrics to guide them to the best possible outcomes in terms of conversions, closed-won deals, and sales productivity.
Using sales and customer data to measure, track, and project your sales organization’s performance is table stakes in today’s increasingly tech and data fluent organizations. What separates truly exceptional sales teams from the rest is how they use sales metrics and reporting strategically.
For instance, sales operation professionals using data to improve the territory assignment of sales reps can increase revenue by as much as 2-7%. Additionally, more-accurate sales metrics tend to correlate to higher sales revenue. Teams can also use sales metrics to project future performance, which can impact budgeting and long-term planning business-wide.
In the first part of our guide, we’ll cover the process of collecting and tracking pertinent data in a high-performing sales organization. Then, we’ll discuss how to use sales metrics to optimize your sales processes for efficiency and revenue in every major sales role.
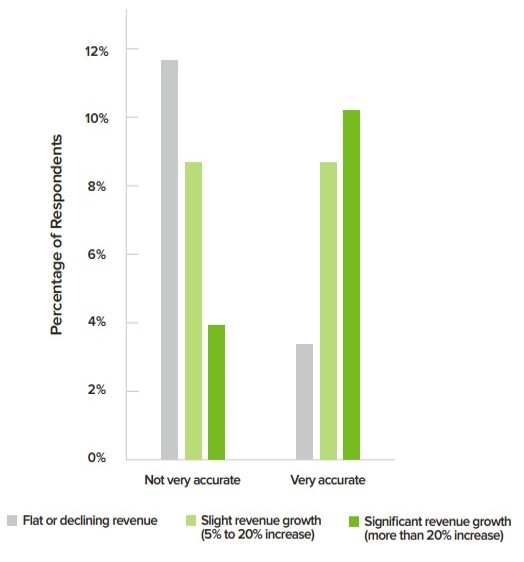
Inaccurate sales metrics correlate to poor revenue, while accurate metrics correlate to growing revenue. Image courtesy AA-ISP
Collecting data
For your sales metrics to be effective, they need to be as accurate as possible. Your decisions will only be as good as the quality of data they’re based on.
So what sales metrics matter most for your team? Let’s take a look at the two most common kinds of data available to revenue teams:
First-party product and marketing data: This is called “first party” data, because it’s data that’s generated on your property, such as on your website or through your company’s software products. The most common way of collecting this kind of data is through a third-party analytics vendor. Customer data can answer important questions along your marketing and product funnel. Which events indicate interest from customers? Which events suggest they’re moving down the funnel towards conversion or retention? Some examples of first-party data include:
Product usage data - Such as clickstream data and product usage metrics
Marketing data - Such as whether users subscribe to an email, user behavior patterns, or website pageviews
Third-party sales data: This includes data-related processes such as lead enrichment or lead scoring. Your revenue team performs such processes on leads or accounts to enrich them with details that enable your sales team to target and follow-up relevant leads more quickly and successfully. Common third-party sales data vendors include Clearbit, Datafox, and several others. Some examples of third-party data include:
Firmographic - Such as company size, business vertical, total amount of funding, and location(s)
Demographic - Such as a lead’s job title, age, and location
Technographic - Which software tools a prospect’s company uses in its tech stack or on its website
Once you collect the data that’s most relevant to your team, your next step is using it to make decisions.
Making data actionable
Let’s just say it’s hard to take action on a pile of raw, untreated data on its own, or on data that’s locked up in separate, siloed tools. Also, sharing data for the sake of sharing doesn’t necessarily guarantee your teams will find it useful or helpful. Sending irrelevant data to the wrong team is an annoying waste of time at best. In order to empower your sales teams, you need to send the right sales team metrics to the right people, ideally at the right time.
Of the key players in your sales organization, these are the types of data each is likely to use most:
Sales development reps (SDR): marketing and product engagement data, lead scoring and enrichment data
Account executives (AE): sales activities, product engagement data
Sales leaders: sales performance metrics such as activities and pipeline data, as well as sales projections
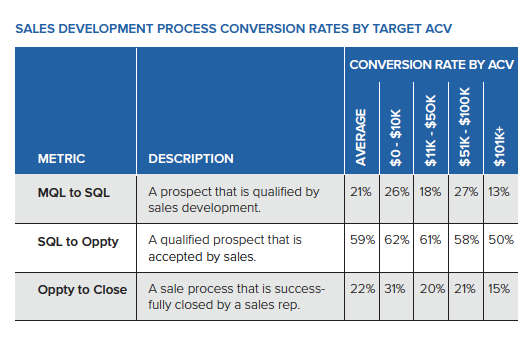
SDRs should target a 50% or higher SQL to opportunity conversion rate. Image courtesy Gartner.
Sales Development Representatives
The SDR is typically the first salesperson that interacts with the lead. Their job is to quickly identify whether the lead is worth having an actual sales conversation. As such, they need as much contextual data about the lead. The goal is to determine whether to qualify it to pass along to an account executive or disqualify it as being not ready.
Here’s a list of sales metrics to measure SDR performance:
SQLs (“Sales-qualified lead”) per week - The main function of an SDR team is to qualify leads for the rest of the sales org to close. The main output of the SDR team are SQLs (Sales-qualified leads), which is not only the key sales metrics KPI of a successful SDR team, but also a leading indicator of total revenue. Since the SQLs are vital sales performance metrics for the health of a company, correctly defining what kind of lead constitutes an SQL requires deep knowledge about your business and the target audience you are selling into.
The definition of a SQL is different at every sales org, but it often touches on traditional BANT factors:
Budget - What is this lead’s total (or approximate) budget?
Authority - Does the lead have decision-making authority?
Need - What’s the level of this lead’s need for your company’s solution?
Timeframe - What are this lead’s timing considerations?
SQL to Opportunity conversion rate (50%+) - Among sales metrics, the SQL-to-opportunity conversion rate is critical in a sales organization. It represents the rate at which SQLs ultimately become sales-qualified opportunities (SQOs) after the account executive team accepts them. SQL to SQO conversion rate isn’t just a factor of how many leads your SDR team is pumping into your funnel, but also something of a quality control metric to assess the SQLs generated. Research suggests that high-performing sales organizations should have a conversion rate of at least 50% to anywhere as high as 62%. A conversion rate that’s significantly lower than 50% may indicate your SDR team isn’t performing quality control and sending too many poor-quality leads to the AE team, which rejects many of them. A conversion rate in excess of 65-70%+ may indicate that an incredible interest in your company’s product, but it may also indicate overeager AE teams accepting too many lower-quality leads as SQOs.
Average lead response time - For inbound sales representatives, average lead response time is crucial. Research suggests that following up with prospects within an hour increases the likelihood of qualifying a lead by 7x. Up to 50% of buyers will go with the vendor that responds first. There are many different ways to measure this metric, depending on your inbound tech stack. For example, if you’re using a live chat tool or ticketing system, chances are that your vendor will automatically measure the time to first touch. If your SDRs are calling leads who leave their phone numbers, those SDRs should record their activities (including phone calls) so that you can measure the response time differential between the first contact and the follow-up call.
SDR Activities - Every part of a sales org should be diligent about recording and measuring sales activity. Relevant SDR activities to cover in your sales team metrics might include emails sent, phone calls logged, and chat conversations logged.
Given the incredibly important role that SDRs play in generating pipeline, sales managers need to stay on top of these sales activity metrics. A dip in SDR activities can often lead to a dip in SQOs. (This article explains how to create an automated SDR leaderboard that empowers sales leaders and SDRs to hit their targets.)
SDRs might review contextual data such as:
Lead enrichment: Using a service like Clearbit or Datafox that can enrich a lead with an email address or even an IP address enables SDRs to disqualify irrelevant leads immediately and to craft a personalized outbound message. Enrichment data might include company size, company vertical, job title, and tools enabled on that company’s website.
Product usage: Though every company will measure this differently, product usage data is another key indicator of whether leads have a demonstrable need for your company’s product. For many freemium tools, product usage or engagement provide clear insight into whether leads find your products and services valuable. Astute sales teams keep a dashboard of accounts with steadily-increasing engagement over time to know when and how to approach them with a sales conversation on renewals or upsells. Sales teams also can use product usage data to personalize messaging: “We noticed you’re trying to accomplish a certain task, but haven’t tried out a specific product feature. I’d love to show you how.”
In summary:
For SDRs, the key metrics that matter are SDR activities, SQLs, and SQL-to-opportunity conversion rate. SDR organizations frequently measure success by how many SQLs they generate, and a key tracker of productivity is SDR activities.
Everyday goals should include SQLs, SDR activities, and SQL-to-opportunity conversion rate, so it’s important to ensure your SDR team is working towards scheduling calls, sending emails, and quickly qualifying leads that are worth passing along to the account executive team.
To help SDRs do their jobs as easily as possible, product usage and lead enrichment provide the necessary context to estimate the size and feasibility of a deal.
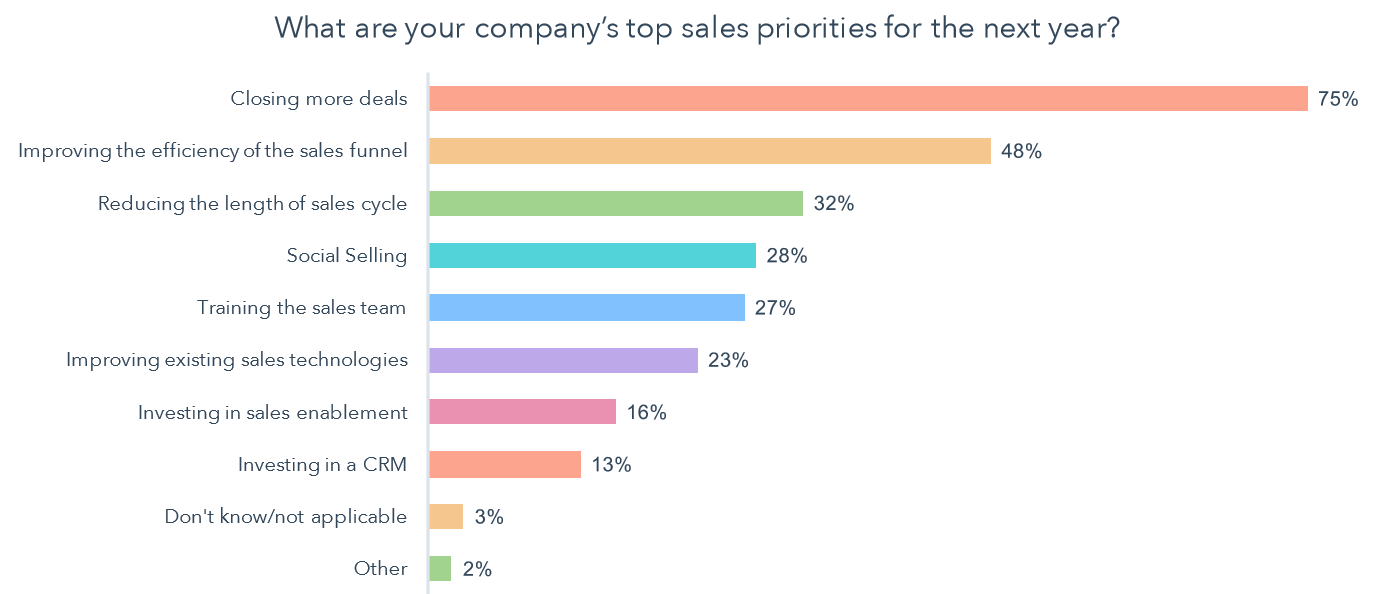
The top priority of sales orgs is still closing more deals. Image courtesy Hubspot State of Inbound
Account Executives
The best account executives are ruthlessly efficient with their time by prioritizing their accounts and opportunities. To help in both prioritizing opportunities and understanding how to move a deal forward, they utilize as much contextual information about their accounts as possible.
Here is a list of sales metrics to measure the performance of AEs:
Sales activity (phone calls, emails, meetings)- Similar to measuring SDR activity, these metrics (which are often broken into # of calls, # of emails sent, # of demos scheduled, # of meetings) measure the productivity of the sales organization. These are all important metrics to track because they are actions that reps can control completely, and can be a good starting point to identify areas for improvement within the sales org.
Demos scheduled - This is a key event under larger “sales activity” that is a strong leading indicator of how many opportunities are eventually created. After discovery calls, product demos are often part of the early sales process. Tracking the number of demos offered can indicate how many leads come through the sales org, as well as the productivity of one or many sales reps.
Opportunities created - This is the number of sales opportunities created that the sales rep agrees to pursue. Opportunities are an important mid-funnel benchmark to measure because they relate directly to how much total business a sales organization can win.
Win rate - Win rate is the percentage of opportunities that are created that become closed-won. AEs all have their own personal win rates. However, it’s also important to track the aggregate win rate of the entire sales org to detect opportunities for improvement. Of course, win rates reflect how strong the sales org (or individual rep) is at closing deals. However, win rates may also reflect narrowness in the parameters your sales org uses to create opportunities. In other words, an extremely high individual win rates against a relatively small number of opportunities might indicate that AEs are focusing only on opportunities with a 100% chance of closing. Excluding other high-probability opportunities could mean your AE teams are leaving money on the table.
In summary:
For AEs, the key metrics that matter are sales activities, opportunities won, and win rate.
The everyday goals of typical AEs should be sales activities and opportunities won.
To help AEs prioritize their opportunities, product usage and lead enrichment provide the necessary context to quickly understand the size of a lead’s business and the likelihood of closing.
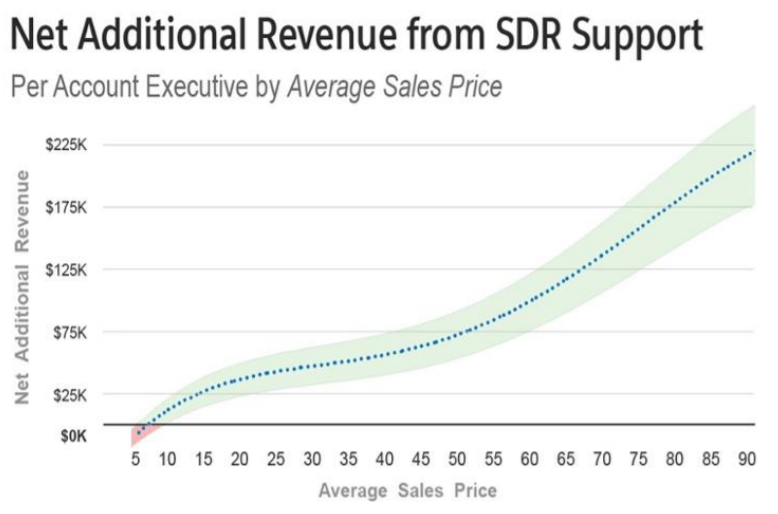
Sales organizations with strong SDR teams generate significantly higher revenue. Image courtesy Forentrepreneurs
Sales leaders
Sales leaders need a strategic view of the larger sales org, as of today and compared against future revenue projections for next quarter. They need to be able to see overall pipeline health, which is a leading indicator for future sales. They also need to be able to assess the productivity of the sales organization.
Here’s a list of sales metrics that are essential for sales leaders:
Web traffic and inbound lead metrics: Inbound metrics will obviously be more important depending on how many sales leads come in from inbound. Are traffic/inbound leads growing month over month? What’s driving this traffic? Organic search/SEO? Paid channels? If inbound is providing a significant source of leads, how can the organization increase inbound leads? For organic channels, could more SEO-focused offers bring in more leads? For paid channels, could targeting specific leads by job title, location, industry, or any other parameter for specific paid campaigns bring in more leads? If the majority of sales come from inbound, it’s critical to invest in inbound as a source of future business.
Outbound sales activity: Conversely, if the majority of your sales leads are from outbound, outbound sales metrics can help you determine how to grow outbound leads. For example, outbound sales metrics can help you determine whether it’s time to hire more outbound SDRs to focus primarily on cold emails, cold calls, or warm follow-ups from various marketing campaigns.
Number of SQLs: SQLs are a key metric for the sales funnel as it often sits between marketing and sales, and is the first line of defense as to whether a lead genuinely has a business need and demonstrable interest in your product and talking to your sales team. Moreover, since this is a leading indicator of pipeline and ultimately revenue numbers, this is an important metric for sales leaders to watch.
Number of opportunities created: Another key metric in the sales funnel is the number of opportunities created. Obviously, at a glance, more opportunities are always welcome. However, as we discussed earlier, an organization that generates too many opportunities may be too lenient in its qualification criteria. Criteria that are too lenient can lead to qualifying leads that aren’t ready to speak to sales. As a result, your team takes a sales productivity hit as they chase unqualified leads and your win rate ultimately drops over time.
Win rate: The win rate is the fundamental quality control metric for a sales organization. In addition to gauging the individual performance of your AE team, it can also, when considered with opportunity count, help you determine the quality of opportunities in pipeline. Is the AE team saying “yes” to too many opportunities, leading to a lower win rate? Are they saying “no” to too many opportunities and leaving money on the table? For instance, the average win rate for sales in SaaS is 20-25%.
Average sales cycle: The duration of the average sales cycle includes the time between first touch and the close of the deal. Average sales cycle helps sales leaders gauge not just the general efficacy of the sales org, but also potential quirks for specific product lines, selling to specific verticals, or changes in the market.
Average deal size: The average dollar amount per deal helps sales leaders build projections and plan for the future. Tracking average deal size helps sales leaders understand and anticipate revenue from specific product lines, teams, territories, or customer verticals. Sales leaders frequently use average deal size to forecast revenue for future quarters to plan for future hires/staffing, territory breakouts, and overall sales budgets.
Sales activities: Sales activities, including demos scheduled, calls, and emails help sales leaders assess the productivity of the sales org.
Customer acquisition cost (“CAC”) and Lifetime Value (“LTV”): CAC and LTV define the longevity and sustainability of the business. Obviously, the average cost to acquire a new customer must be less than the lifetime value of that customer (otherwise your company will run out of cash acquiring new customers whose revenue doesn’t cover the cost acquisitions). Depending on your business, LTV will ideally grow over time as accounts renew and expand with greater usage.
In summary:
For sales leaders, the key metrics that matter are SQLs/opportunities created, win rates, and deal sizes. These key sales metrics give sales leaders an immediate glimpse into the health of the company’s sales org.
Sales leaders’ everyday goals should focus on supporting the revenue teams to stay productive and maximize leads and opportunities. They also need to be strategic in projecting future revenue and allocate resources accordingly for future hires and planning across different territories, teams, and product lines.
To help sales leaders support revenue teams, they need trustworthy, responsive data and metrics to quickly identify problems and inefficiencies within the sales and marketing org.
Fine-tuning revenue projections
Whether it’s even possible to get a 100% accurate revenue forecast is a subject that’s frequently up for debate. However, most sales orgs agree that forecasting can help organizations better plan for headcount, resource allocation, and even seeking additional funding for the company should the need arise. Still, projecting future sales can be tricky given the number of unknowns. Fortunately, using many of the metrics listed in this blog post, we can reduce the margin of error significantly.
One approach to projecting sales is to build estimates around the entire marketing and sales funnel and forecast volume and conversion rates at each stage. To set goals and plan for worst-case situations, you can then impose specific scenarios that impact key sales drivers. For example, an inbound-focused sales organization might vary its projections based on crucial channels such as website traffic; an outbound-focused sales org might vary projections based on how many emails its SDR team sends.
Here’s an extremely simplified example of a potential sales projection for a company that focuses most of its lead activity on inbound:
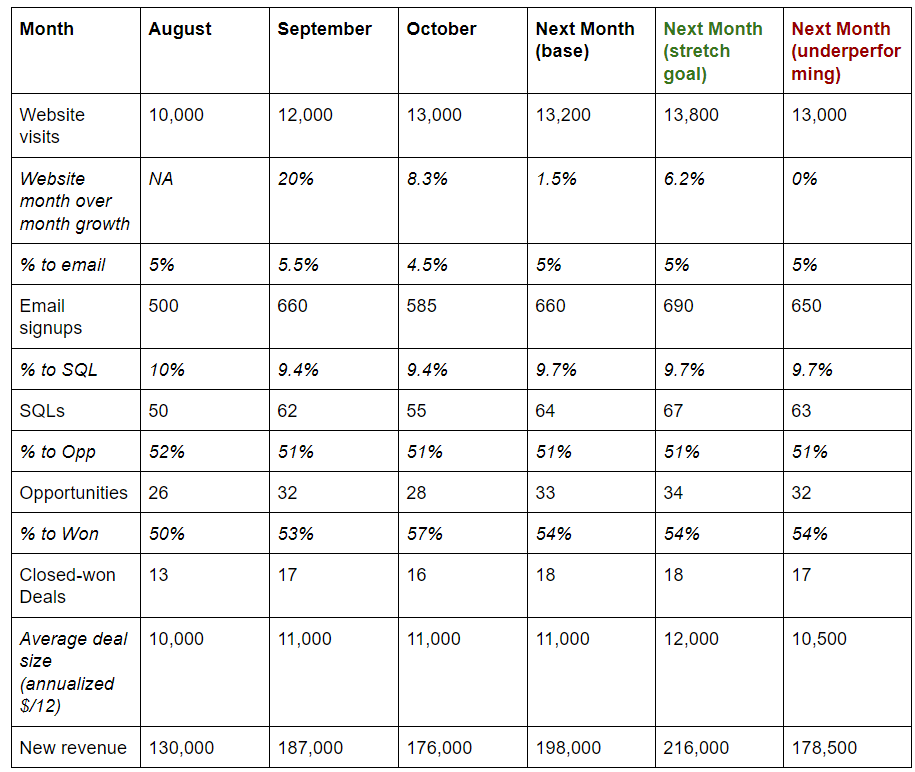
In this example, since we’re tracking the primary conversion events in the funnel (emails, SQLs, opportunities, won deals, average deal size), we can get a quick assessment of where the business is growing and where it’s shrinking. When projecting future sales, we might focus purely on moving the key drivers of sales. In this case, the key topline driver is website visits, though long-term, we might also look for opportunities to improve on our conversion rates.
While performing our analysis, we might ask ourselves questions like: Is there seasonality that affects our website traffic? Will Q4 holiday months be slower than usual? What factors could influence web traffic for this month, such as higher digital ad spend, a major SEO + content campaign, or an individual news event such as a major product launch that may capture the headlines?
We can then project alternate scenarios, such as stretch goals, with minor changes to our key drivers. When we see how tweaks to our key drivers affect our outcomes, we can get a sense of the sensitivity of our model and how it affects the potential range of revenue. And so, in the above example, we’re essentially correlating our inbound traffic to its influence on total sales. A model like this provides the benefit of clarifying quantitative goals for the organization’s leadership and puts into focus which areas need support.
Conversely, here’s what a highly simplified sales projection might look like for a mostly outbound-based organization that focuses on SDR email outreach and is actively hiring more:
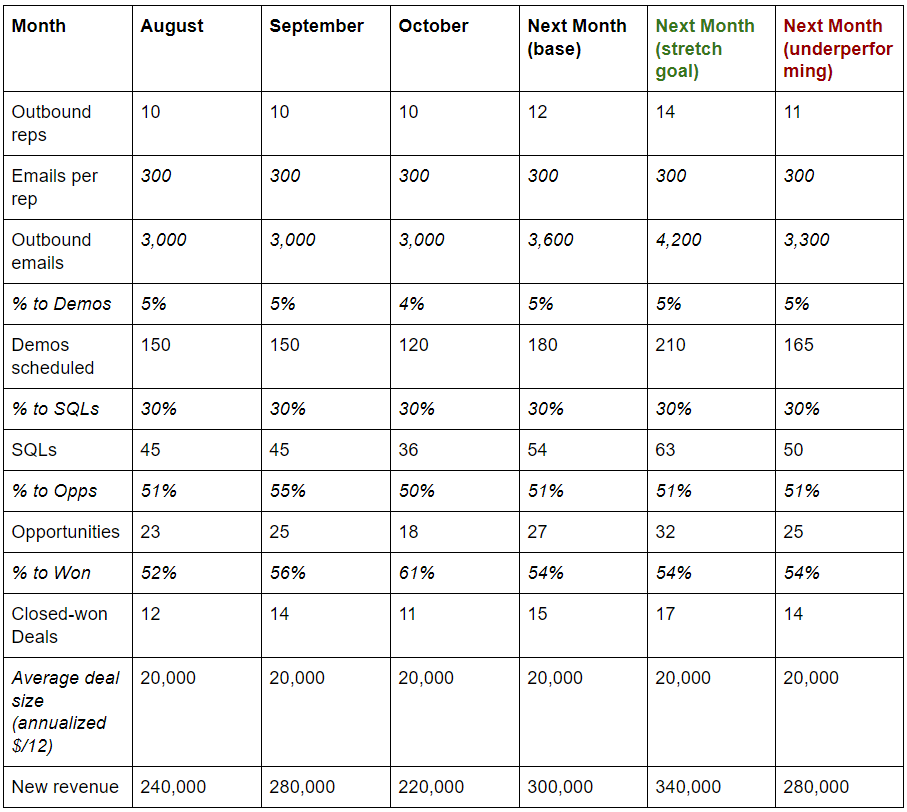
Note that the key sales driver in this example is outbound emails from sales reps. (For the sake of simplicity, we’ve otherwise left this model largely the same as our previous example.) As before, the key here is understanding the business and the funnel enough to know how much specific changes to different conversion rates will affect your overall revenue numbers.
Turning sales operations into a strategic partner
Today’s competitive sales landscape goes beyond measuring and providing key sales metrics to the right members of the team. Sales orgs now use web and enterprise tools to automate menial tasks, such as lead uploads, lead scoring, and lead routing. Automation lets them focus on pulling actionable insights from the data, rather than spending hours gathering it manually. Learn more about the challenges modern sales operations professionals face, and see automation for sales in action by seeing a demo.
