
Google Analytics 2.0
Google Analytics is an industry-standard web analytics tool
OverviewCopy
Google Analytics is a web analytics service offered by Google that tracks and reports website traffic, currently as a platform inside the Google Marketing Platform brand.
AuthenticationCopy
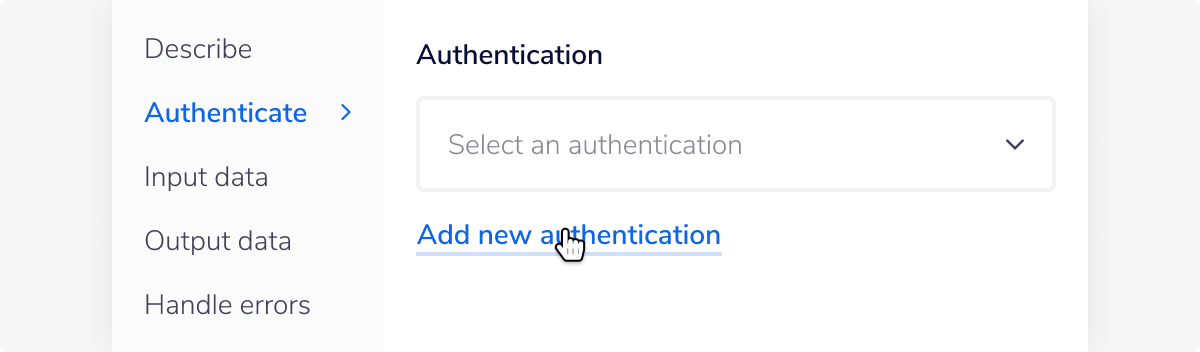
Within the workflow builder, highlight the Google Analytics connector.
In the Google Analytics connector properties panel to the right of the builder, click on the Authenticate tab and the 'Add new authentication' button.

This will result in a Tray.io authentication pop-up modal. The first page will ask you to name your authentication and select the type of authentication you wish to create ('Personal' or 'Organisational').
The next page asks you to select your 'Service permissions'. All the permissions are by default selected. Feel free to remove any permissions of your choice by unchecking the checkbox available beside the specific permission.

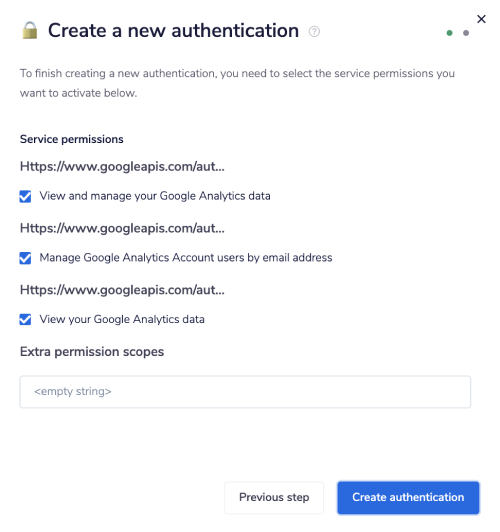
Once you have selected the permissions of your choice, click the 'Create authentication' button.
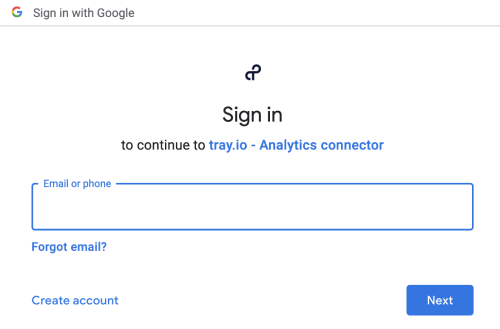
Upon clicking 'Create authentication', you will be prompted to sign in to your Google Analytics account.

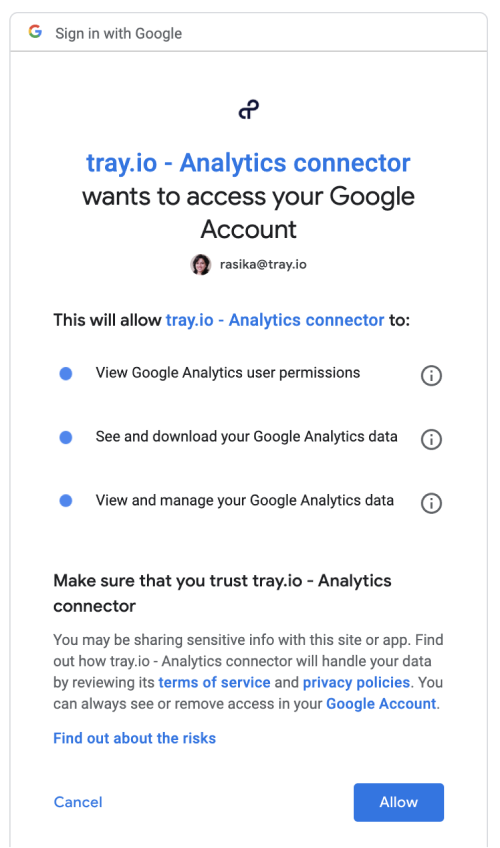
After you have logged in with your Google Analytics credentials, you will be asked to confirm the access you are granting to Tray.io. Once you have reviewed the permissions, click 'Allow access'.

Now, go back to your settings authentication field (within the workflow builder properties panel), and select the recently added authentication from the drop-down options now available.
Your connector authentication setup should now be complete.
Available OperationsCopy
The examples below show one or two of the available connector operations in use.
Please see the Full Operations Reference at the end of this page for details on all available operations for this connector.
Example UsageCopy
TRAY POTENTIAL: Tray.io is extremely flexible. By design there is no fixed way of working with it - you can pull whatever data you need from other services and work with it using our core and helper connectors. This demo which follows shows only one possible way of working with Tray.io and the Google Analytics connector. Once you've finished working through this example please see our Introduction to working with data and jsonpaths page and Data Guide for more details.
The workflow below shows how to run a basic Google Analytics report.
The steps involved are:
Setup using a manual trigger (note that it is likely that you would wish to use a Scheduled Trigger and the last runtime method to set the date range for your report).
Get web properties for the selected account.
Run an analytics report based on the specified criteria.
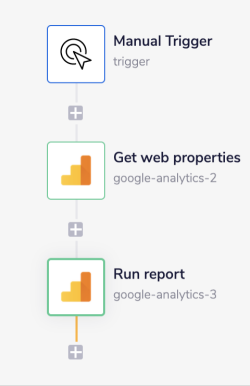
Your completed workflow should look similar to this:

1 - Setup Trigger & get web propertiesCopy
Select the Manual trigger from the trigger options available. From the connectors panel on the left, add a Google Analytics connector to your workflow. Set the operation to 'List web properties'.
Select the 'Account ID'of your choice from the available drop-down options.

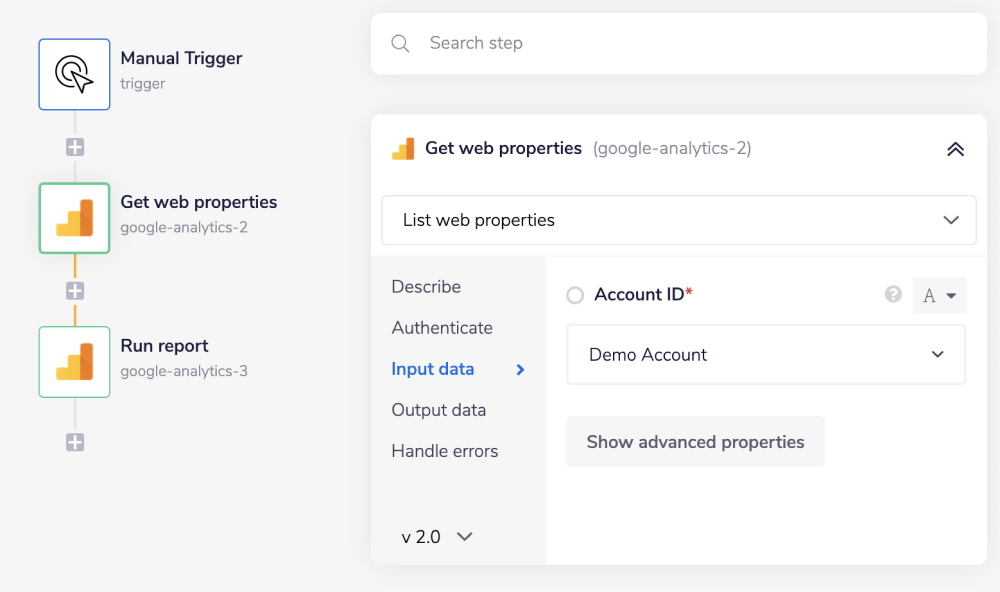
Feel free to re-name your steps as you go along to make things clearer for yourself and other users. The operation names themselves often suffice.
The List web properties operation will fetch the web properties for the selected account. These web properties will be used in the next step to generate the analytics report.
2 - Run reportCopy
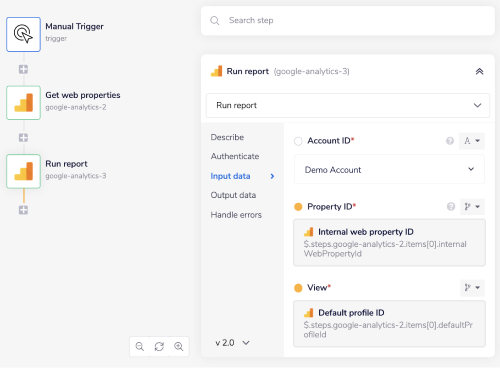
Next, again add a Google Analytics connector into your workflow as your next step. Set your operations to 'Run report'.
In the properties panel, select the same 'Account ID' as in the previous step.
Use the connector-snake to find the jsonpath for the 'Property ID' field from the previous step. It should appear simillar to $.steps.google-analytics-2.items[0].internalWebPropertyId.
JSONPATHS: For more information on what jsonpaths are and how to use jsonpaths with Tray.io, please see our pages on Basic data concepts and Mapping data between steps
CONNECTOR-SNAKE: The simplest and easiest way to generate your jsonpaths is to use our feature called the Connector-snake. Please see the main page for more details.
The 'Property ID' here represents an ID of a website, mobile application, or device for which you wish to generate the report. A particular account can have more than one property associated with it.
Simillarly, Use the connector-snake to find the jsonpath for the 'View' field from the previous step. It should appear simillar to $.steps.google-analytics-2.items[0].defaultProfileId.

To create a view, along with the view ID, you also need to provide a set of specifications to define the view. The specifications are provided based on the Dimensions and Metrics.
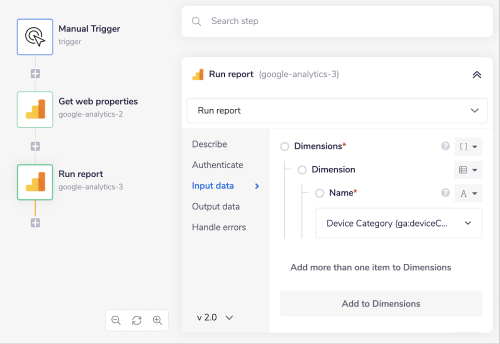
The Dimensions are attributes of your data. The Metrics represent quantitative measurements. To learn more about Dimensions and Metrics, refer to the Google Analytics documentation on Dimensions & Metrics Explorer To add Dimensions to the view, in the properties panel with the 'Run report' step highlighted, scroll down below the 'View' field. Click the 'Add to Dimensions' button. Select the 'Name' of the dimension from the available drop-down options.
You can add multiple dimensions based on your preference. In this example, we have selected the Device Category (ga:deviceCategory). This dimension will provide the type of device that the user has used to visit a particular property for the selected account. The type of device could be desktop, tablet, or mobile.

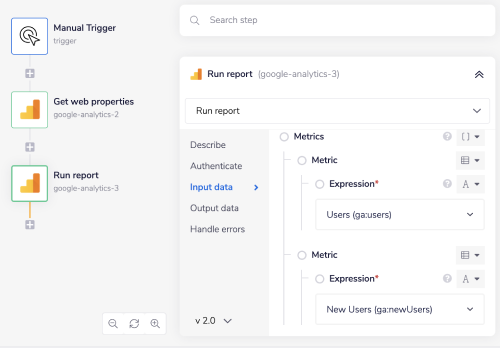
Now, to select Metrics. On the same properties panel scroll down and click the 'Add to Metrics' button. Select the 'Expression' for the metrics from the available drop-down options.
You can add multiple metrics based on your preference. In this example, we have selected the Users (ga:users) and New Users (ga:newUsers) expressions.
The Users (ga:users) expression will provide us the total number of users who have visited the selected property for the requested time period.
The New Users (ga:newUsers) expression will provide the number of sessions marked as a user's first sessions.

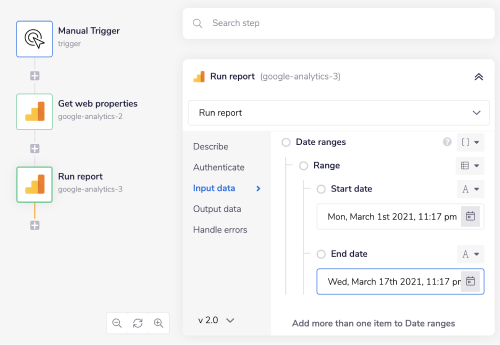
Lastly, select the 'Date ranges' available on the same property panel below the 'Metrics' field. Here select the 'Start date' and the 'End date' defining the tenure you would like to generate the analytics report for.
These date ranges could be passed in from a previous Date and Time Helpers step, as explained in the guide to the last runtime method

A report that would be generated for the selected Account and Property combination would look simillar to this:
1{2"reports": [{3"columnHeader": {4"dimensions": [5"ga:deviceCategory"6],7"metricHeader": {8"metricHeaderEntries": [{9"name": "ga:users",10"type": "INTEGER"11},12{13"name": "ga:newUsers",14"type": "INTEGER"15}16]17}18},19"data": {20"rows": [{21"dimensions": [22"desktop"23],24"metrics": [{25"values": [26"303",27"38"28]29}]30},31{32"dimensions": [33"mobile"34],35"metrics": [{36"values": [37"756",38"151"39]40}]41},42{43"dimensions": [44"tablet"45],46"metrics": [{47"values": [48"19",49"0"50]51}]52}53],54"totals": [{55"values": [56"1078",57"189"58]59}],60"rowCount": 3,61"minimums": [{62"values": [63"19",64"0"65]66}],67"maximums": [{68"values": [69"756",70"151"71]72}],73"samplesReadCounts": [74"986"75],76"samplingSpaceSizes": [77"3828"78]79}80}]81}
For more clarification on the pathways you have available, open the Debug panel to view your step's Input and Output.
Intermediate examplesCopy
Please note that this is a very basic example which only intends to introduce you to some of the standard Tray.io tools you can make use of. The final step introduces you to a more likely database scenario, whereby you can extract and store key information to be queried.
Take some basic actionsCopy
The following shows a slightly extended workflow which introduces some basic actions you could take with the results obtained from your report:

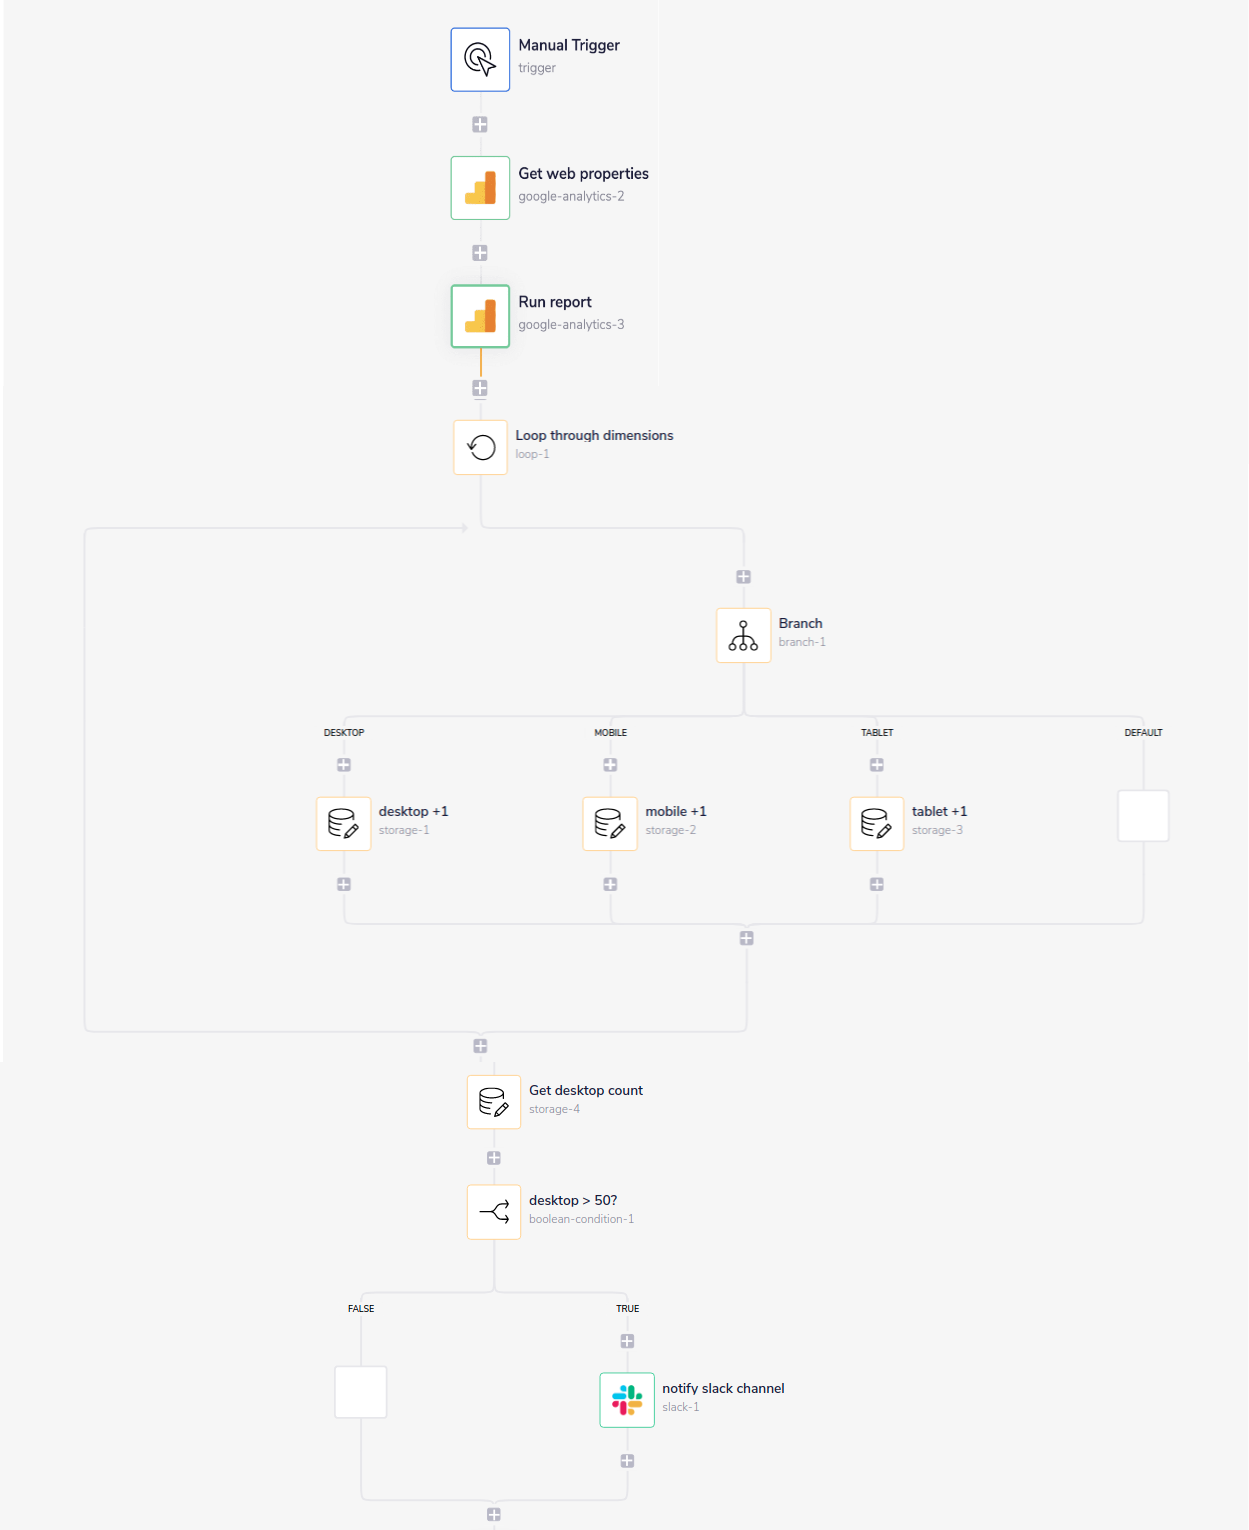
From the results produced by Run report, the following steps are taken:
The Loop through dimensions step uses a Loop connector to loop through the rows of returned data with
$.steps.google-analytics-3.reports[0].data.rowsThe branch connector step checks the result of
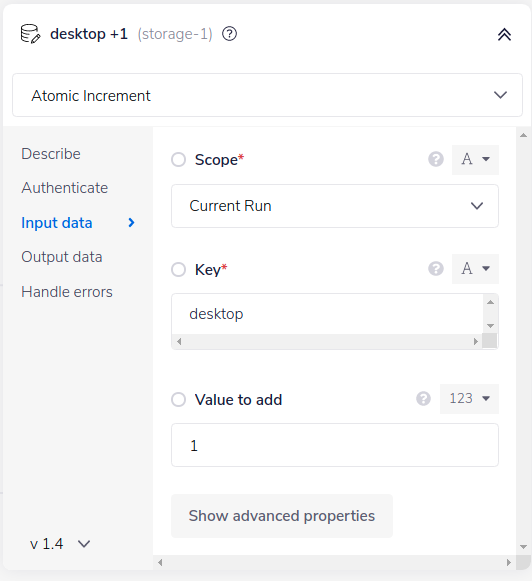
$.steps.loop-1.value.dimensions[0]and sets a branch for each possible result - desktop, mobile or tabletOn each branch a Data Storage 'Atomic Increment' operation is used to add 1 to the count for the appropriate key (desktop +1, mobile +1 or tablet +1):

After looping through all results, the Get desktop count uses a Data Storage get value operation to retrieve the count for 'desktop'
The desktop > 50? uses a boolean connector to check if the desktop count is greater than 50
If true then notify Slack channel sends a simple "you have more than 50 desktop visits this week" message to a Slack channel of your choice
Storing results in a databaseCopy
A more realistic implementation would be to store the results of your reports in a database, using any one of our SQL database connectors. This would allow you to build a robust, scalable database that can be queried using the powerful SQL query language and other features available in the more powerful data warehouses, such as Snowflake, BigQuery and Redshift
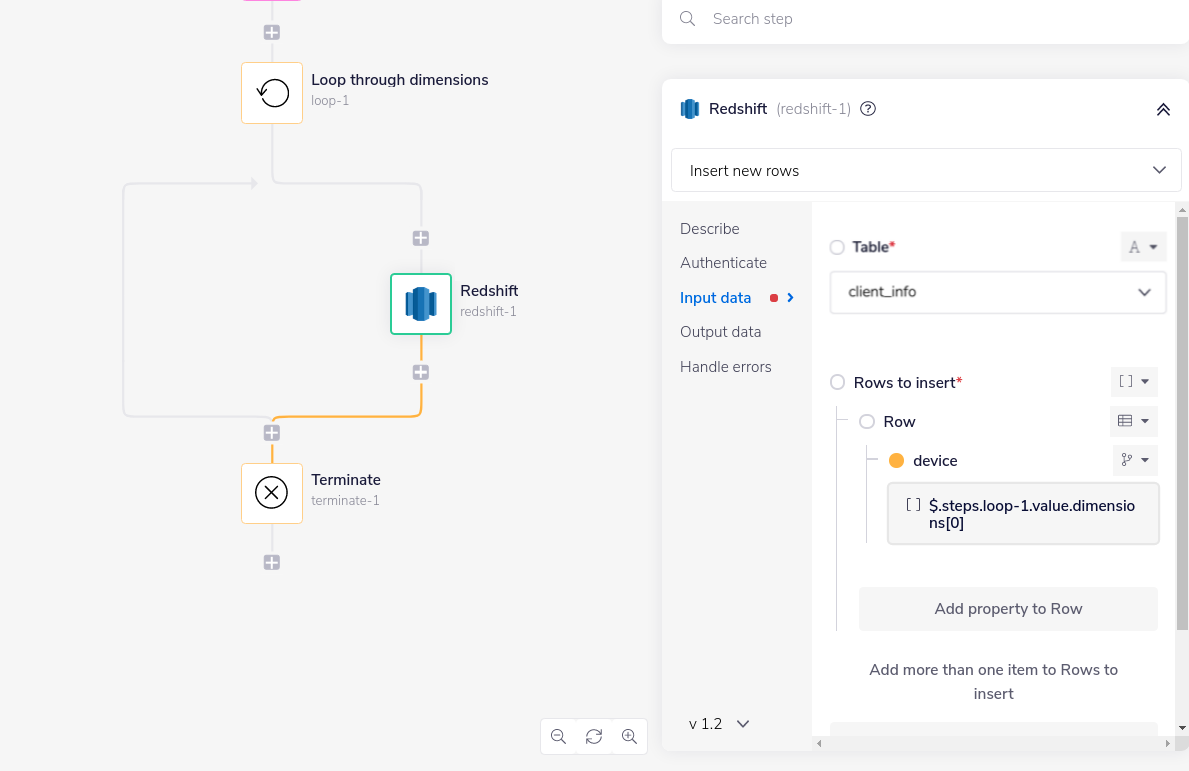
The following example shows looping through the above results and sending them to a table in Redshift:

BEST PRACTICES: Whenever you do decide to create your own workflow, be sure to check out some of our key articles such as: