Logs and debugging
How long you will be able to access logs and replay associated workflow runs will depend on your package:
Pro = 7 days from the last workflow run
Team = 7 days (30 days as optional add-on)
Enterprise = 30 days
Intro to LogsCopy
When a workflow is run, it will produce a workflow log:

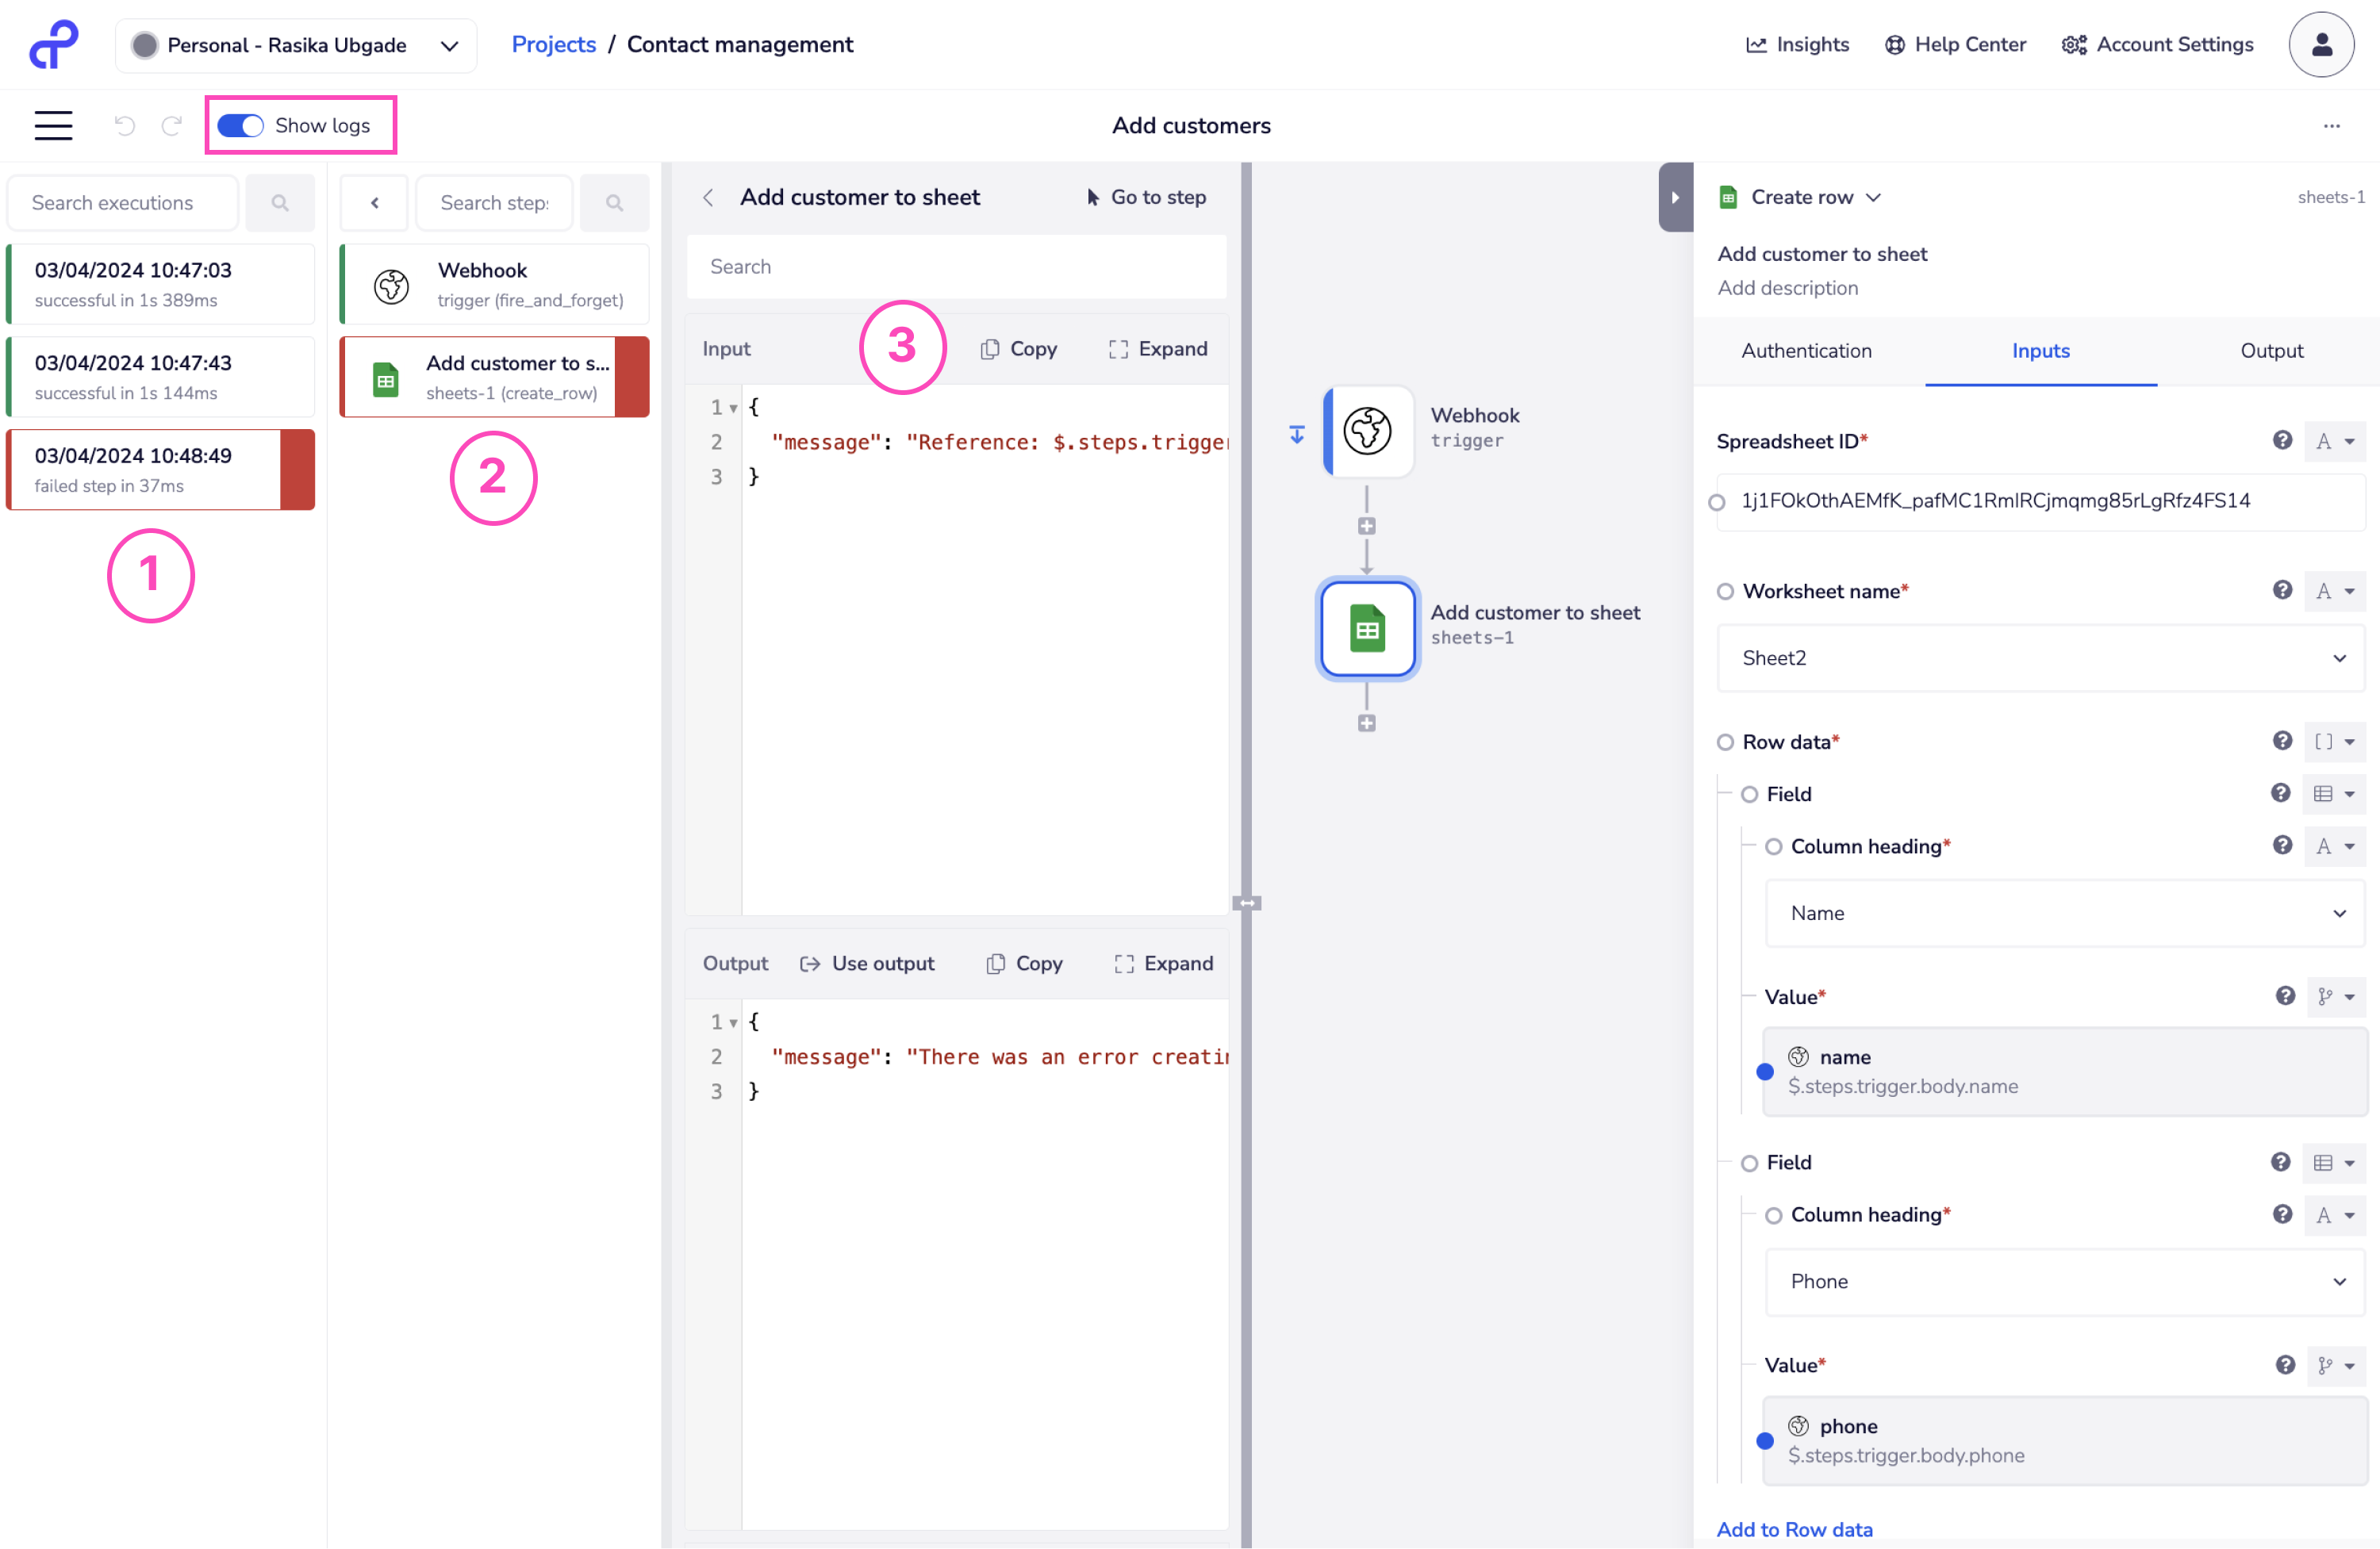
This includes:
A successful or failed RUN of the workflow in the first panel (1)
A successful or failed STEP for each workflow step in the second panel (2)
An Input and an Output record of each individual Step in the third panel (3)
Logs make it easy to investigate and correct any issues with your workflows.
Basic error messagesCopy
In the above example we can see that this workflow has produced a series of green successful runs, followed by a failed run.
In the failed run, it is the 'Add customer to sheet' step that has failed.
If we look in the input and output panels for the failed step we see the messages:


This tells us that the jsonpath that is picking up the 'phone' value from the trigger has failed for some reason.
If we then look at a successful output for the trigger step we see the following:

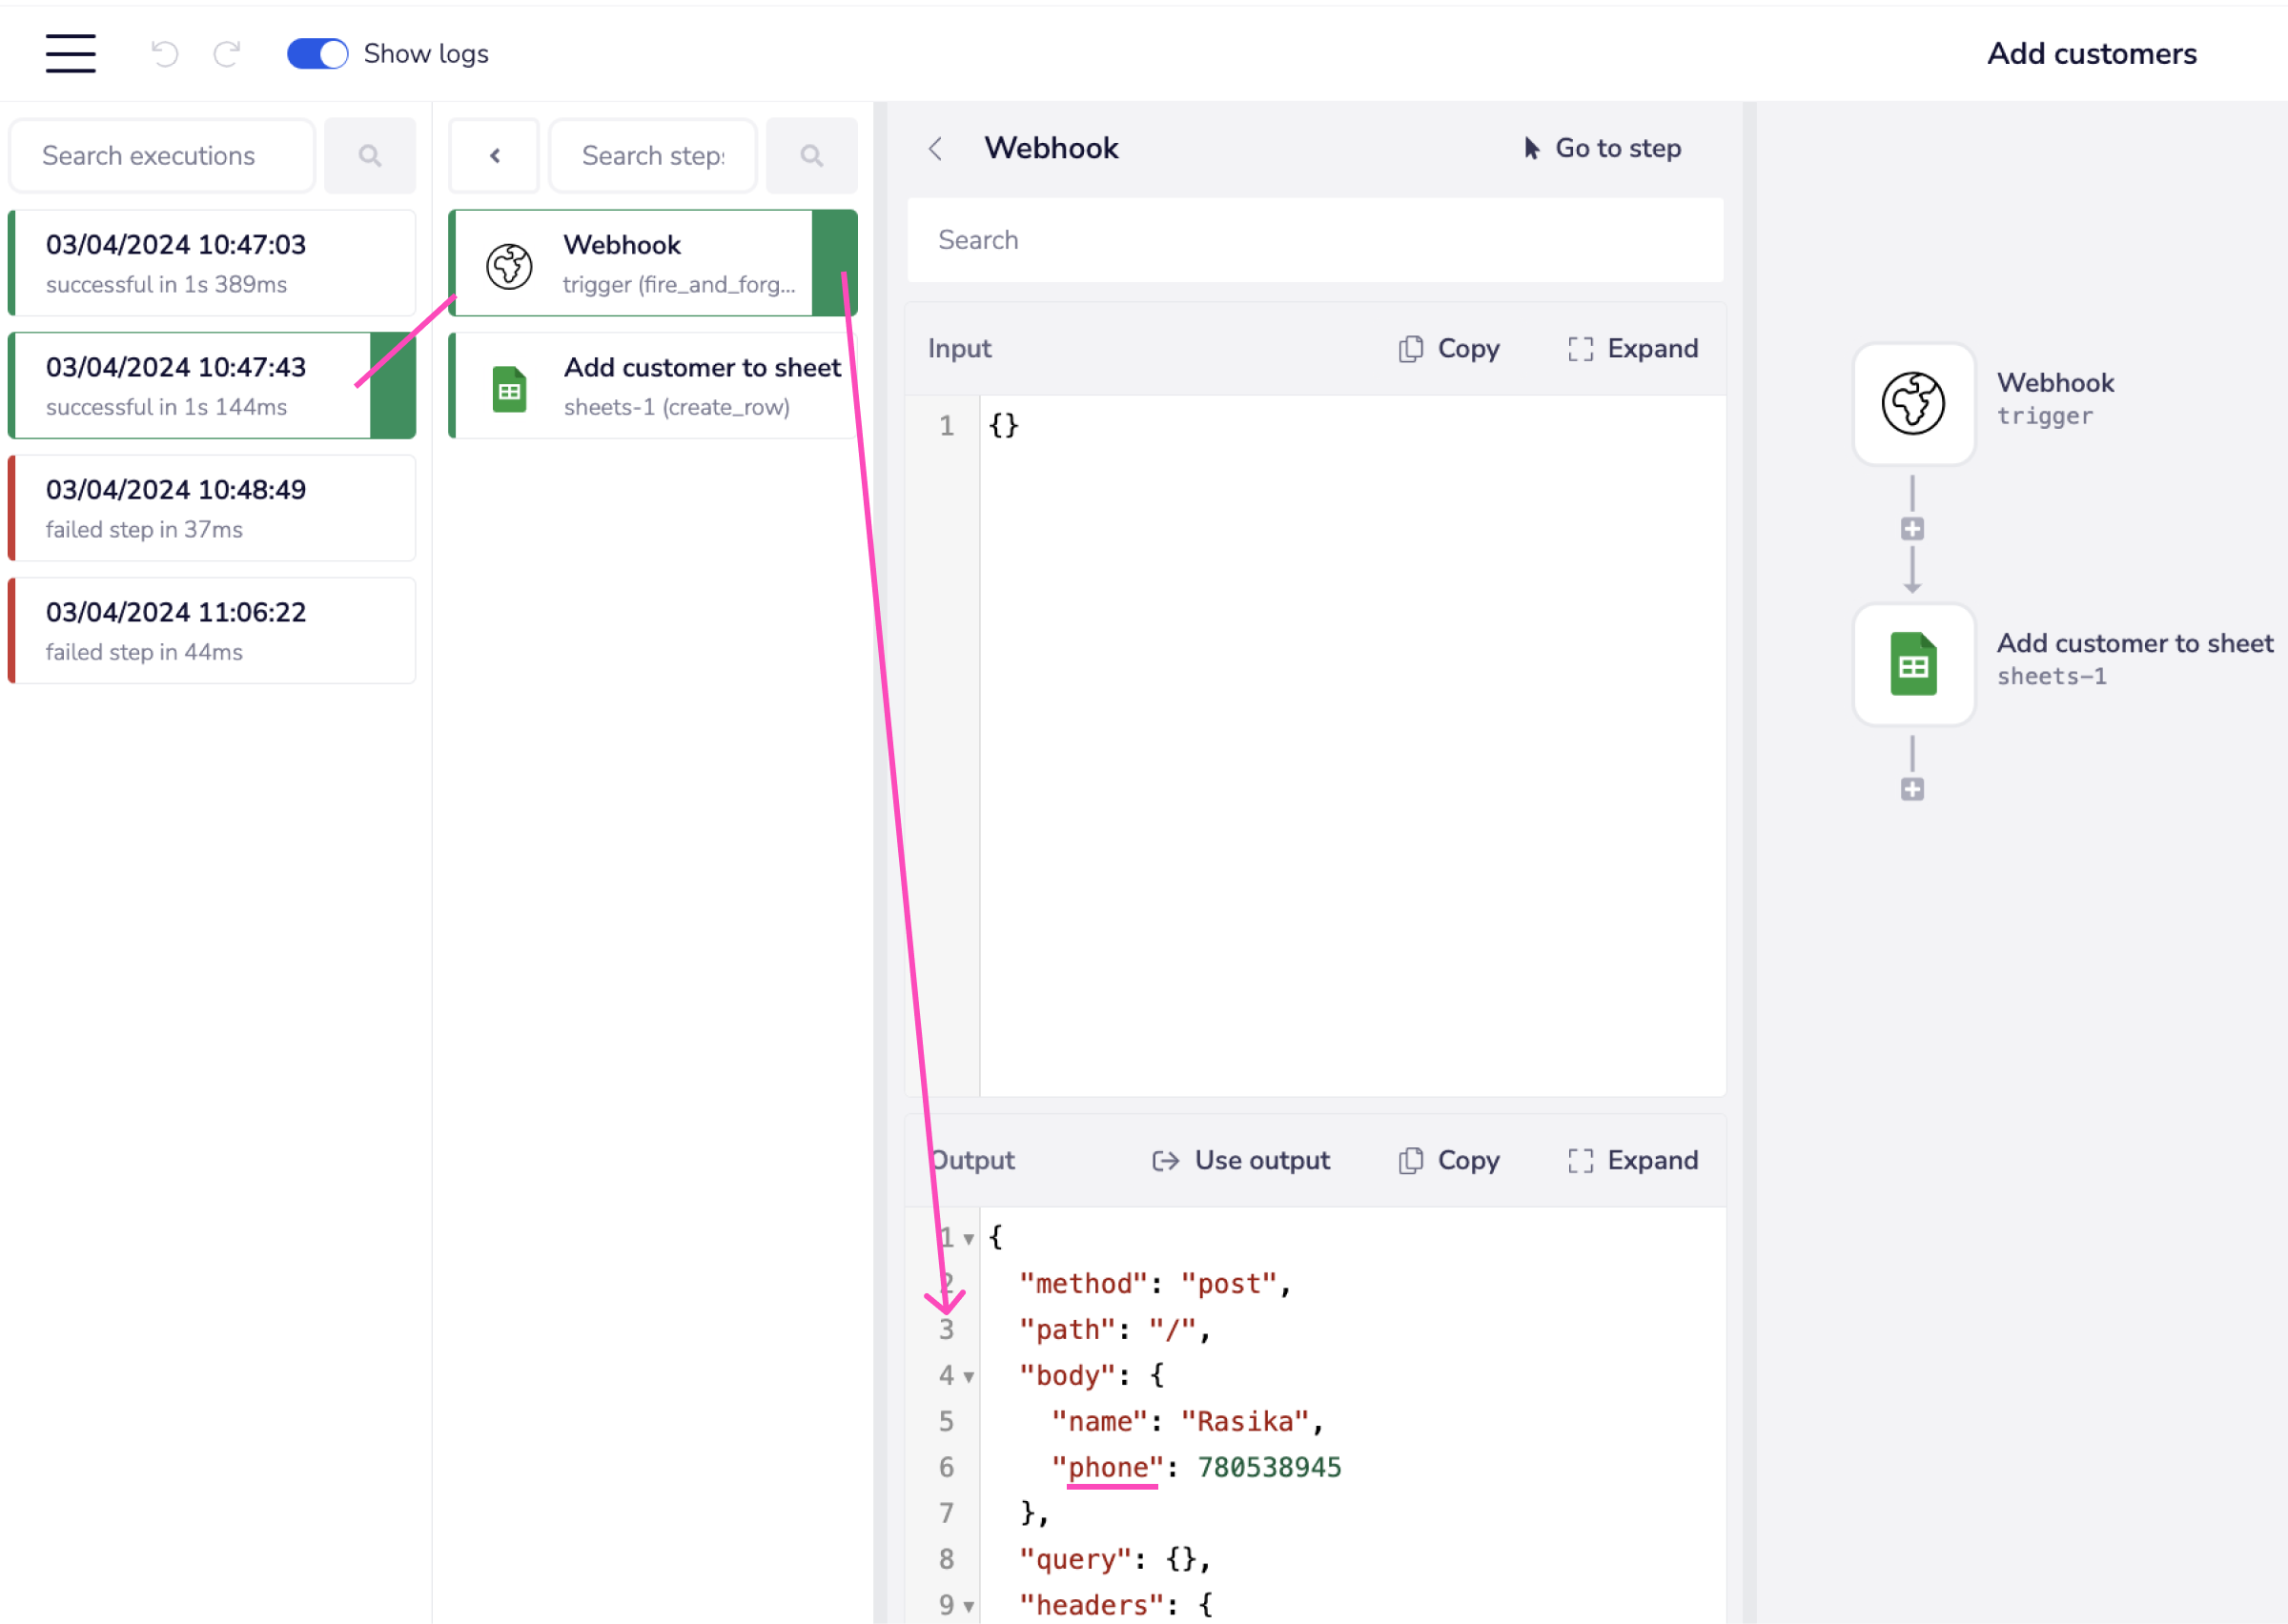
And for the latest failed run we see:

So it seems that the 3rd party which is sending the webhook payloads to our workflow has actually changed its schema, so what was previously 'phone' is now 'cell'.
Fixing errors and re-running executionsCopy
So to fix this we can:
1. Click on the 'use output' button to update the webhook trigger's output schema.
2. Use the connector snake to fix the jsonpath
3. Replay the failed run to ensure there is no data lost in the destination service

It is crucial that you set up your error handling and automated alerting systems in order to pre-emptively deal with scenarios like this.
It is particularly recommended that you make use of the $.errors.step_log_url alerting payload variable in your alerting systems, to enable people to quickly analyze and fix any issues.
Please also see our fantastic Academy course on debugging for some helpful interactive labs on dealing with various common debugging scenarios.
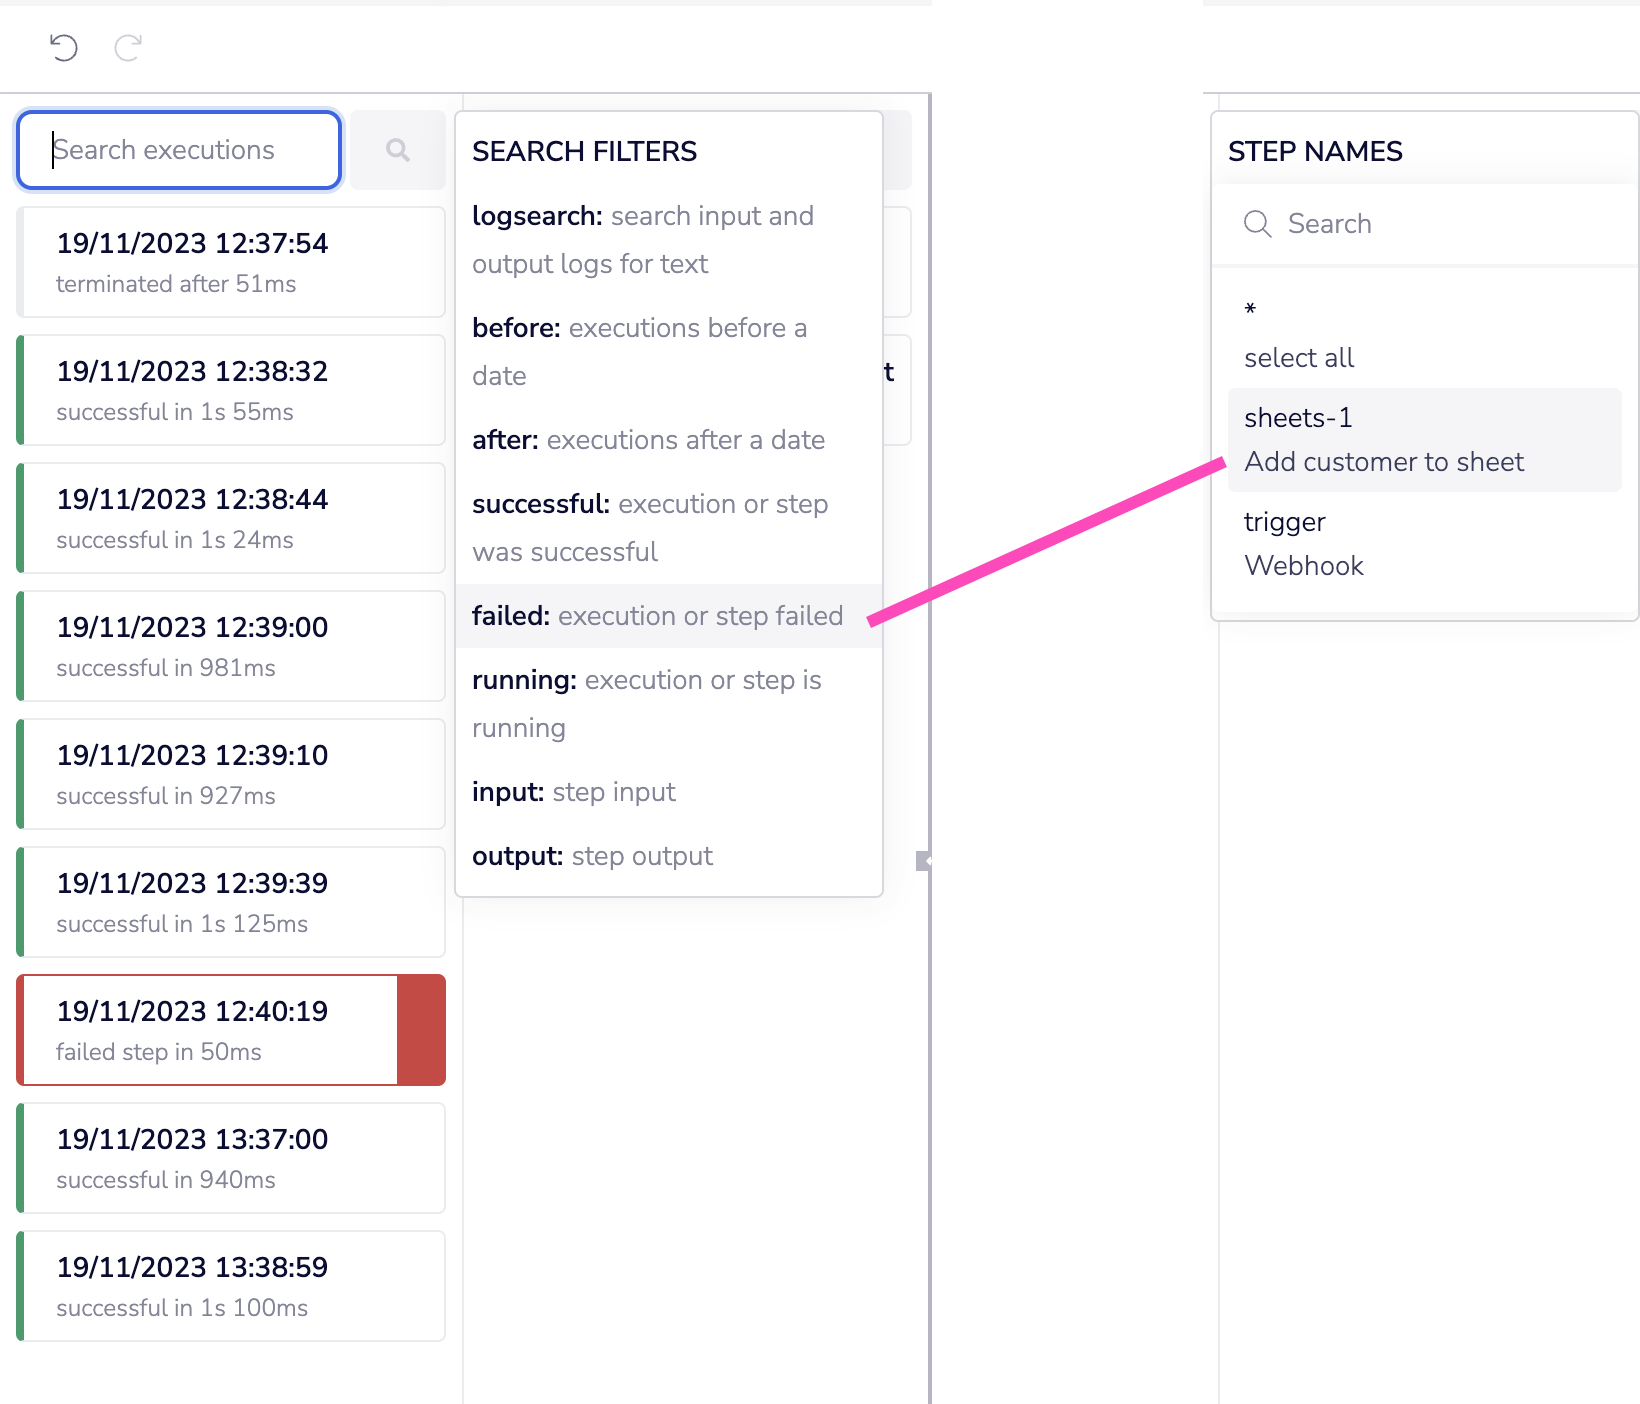
Filtering runs and stepsCopy
Clicking on the search box for runs and steps will bring up a list of filters.
For example you could filter to only show runs where the 'Add customer to sheet' step failed:

Searching logsCopy
Searching logs can be very useful in cases where you are trying to find the exact location of a piece of data within a complex payload.
In this example we are trying to configure a GitHub workflow which notifies us when something has been marked for our review.
Our first attempt didn't work and we are unsure what field to use to pick up the requested reviewer.
We know that our username is 'rasikatechwrite' so we search the output logs for a run of the github trigger:


So this tells us that the correct jsonpath is $.steps.trigger.pull_request.requested_reviewers[0].login
You may find our Ops Explorer dev tool to be useful in helping you fully explore the input and output schema (including dummy payloads) for the various connectors you will be using in your projects.
Useful TipsCopy
Saving & Sharing your QueriesCopy
Should your workflow have several search filters applied, and you know you may need to repeat this search (on this workflow) again, you can save the URL of your search query within your bookmark bar for later use.
Should you return to the bookmark, the saved settings will apply and thus the search itself will automatically update the results depending on the logs that are now available there.
To share your logs filter just send the workflow URL to the user in question (queries will be hashed out in the address bar for security purposes).
IMPORTANT!: Remember that this method only saves the SEARCH so your results may still vary should you change your workflow, alter the steps, the run time change, etc. For example, were you to not run your workflow for 30 days, and then re-run the originally saved search method, no logs will display as it would be past the logs display time limit.
Replaying and stopping runsCopy
How long you will be able to access logs and replay associated workflow runs will depend on your package:
Pro = 7 days from the last workflow run
Team = 7 days (30 days as optional add-on)
Enterprise = 30 days
When you want to replay a run, simply hover over the run log in question, and a new button option will be presented to you. You can also use this method to stop your runs mid flow should you need to.


Note that when you replay a run, a new workflow run is activated and listed in the workflow run log listings.
The original workflow run will still be present, as you have simply triggered the run cycle again. Doing so does not delete or override the previous run. The new run will be displayed directly beneath it, at the bottom of logs listing.
This is especially important in regards to error fixing. For example, say a workflow run failed but the user then fixed the error within the builder. The user could then go back to the run logs listings and select the re-run option, from the previously failed/ red highlighted run.
The previously failed run will still show up in the logs listings, but now there will also be a new (hopefully) green/ successful run directly below it as well.
Logs retention and potential lost dataCopy
As mentioned previously, it is best practice to set up Error Alerting within your workflows, so as to automatically receive notifications when errors do occur. It is very important that you do this in order to deal with anticipated error scenarios, and prevent any potential data loss.
Imagine a scenario where you have a workflow that is designed to create and collect a list of the number of new subscribers who have signed up to receive your product email updates each week. It runs weekly, and usually there are no issues.
Every Monday the workflow creates / collects a list of the new subscribers who joined your product updates emailing list, over the past 7 days, sends you the number, and you then feed it into your marketing chain to do with as you wish.
For whatever reason this time, the workflow errors. You have not set up any error notification handlers to deal with such a scenario occurring, and so you are not aware of this when it occurs.
When you do discover the error, say, the following Tuesday having not received the usual list update, you will be unable to re-run said log. This is because the run log itself is over 7 days old.
This means that the data you would have otherwise received will now be unavailable to you. Even if you trigger your workflow now, and the workflow works perfectly, it will only be picking up the current data, within the current time frame (7 days past from Tuesday, instead of Monday).
PLEASE be wary of such instances occurring. Tray.io is not responsible for data that cannot be recovered and is not backed up. It is only under very rare circumstances that Tray.io might be able to help you retrieve some of your missing data when such instances do happen.
Shift-click to go to stepCopy
If you press 'shift & click' on a connector step within the logs, you will go directly to that step in the workflow builder and open its properties panel for editing.
Logs Status ButtonCopy
There is a grey 'Logs Status Button' at the bottom of the first two panels. This enables you to switch between statuses ('LIVE' and 'PAUSED'), in order to prevent any new workflow runs or steps from appearing.

