
AppNeta 3.0
The AppNeta Performance Manager (APM) is used to monitor your network and web application performance. Specifically, it enables you to determine the source of network problems.
OverviewCopy
The AppNeta Performance Manager (APM) is particularly useful if you are using cloud-based applications, or are running any part of your network across the internet, as it provides visibility into the performance of the applications and the parts of the network you do not control.
AuthenticationCopy
When using the AppNeta connector, the first thing you will need to do is go to your Tray.io account page, and select the relevant workflow. Once in the workflow dashboard itself, search and drag the AppNeta connector from the connectors panel (on the left hand side) onto your workflow.
With the new AppNeta connector step highlighted, in the properties panel on the right, click on 'New Authentication' which is located under the 'Settings' heading.

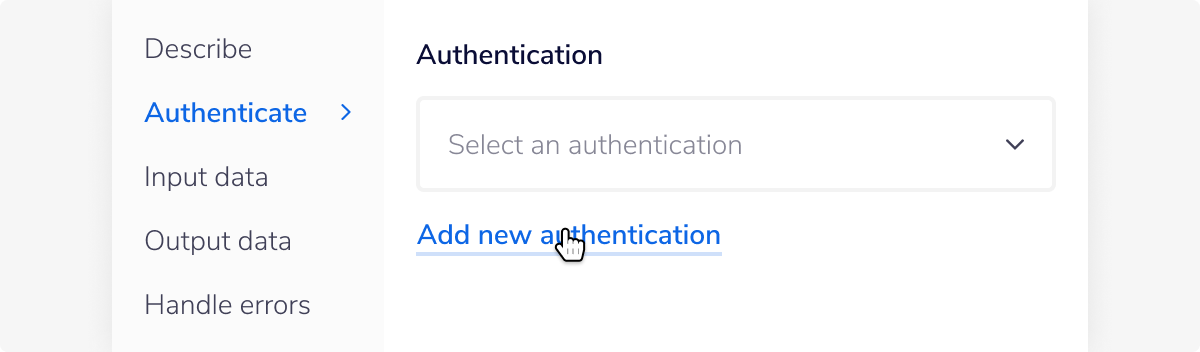
Once clicked on the 'New Authentication' button, you will then need to fill a name and choose whether the authentication to be used personally or by an organization.
Click on 'Nex step'. The second page is about giving Tray.io permission to connect to your AppNeta account. Fill in your 'Email' and 'Password' sections with your AppNeta account details. You will also need your 'APM node' (aka, your "AppNeta Performance Manager Node" details).


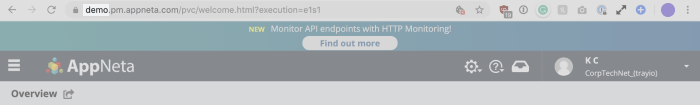
In order to obtain this, login to the AppNeta website . You can find your AppNeta Performance Manager Node at the starting part of the URL. In our example
the APM node is demo. Type your own into the 'APM node' section of the authentication page.
REMEMBER: DO NOT to include the prefix:
https://. You need only the APM node details itself.

You should have now completed the authentication process and be able to use the AppNeta connector.
Available OperationsCopy
The examples below show one or two of the available connector operations in use.
Please see the Full Operations Reference at the end of this page for details on all available operations for this connector.
Using the Raw HTTP Request ('Universal Operation')Copy
As of version 1.0, it is possible to effectively create your own operations.
This is a very powerful feature which you can put to use when there is an endpoint in AppNeta Performance Manager which is not used by any of our operations.
To use this you will first of all need to research the endpoint in the AppNeta API Docs v.3 , to find the exact format that AppNeta Performance Manager will be expecting the endpoint to be passed in. If you are interested in only viewing the endpoints themselves, please see: AppNeta API Index v.3
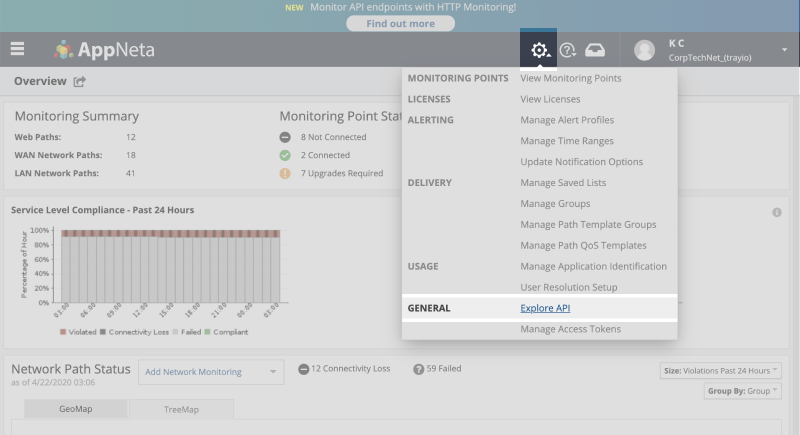
USER TIP: You can also navigate to the gear icon on the top-right of your AppNetadashboard, and select "Explore API" in order to reach the AppNeta API Index directly.

Note that you will only need to add the suffix to the endpoint, as the base URL will be automatically set (the base URL is picked up from the value you entered when you created your authentication).
The base URL is in the format of https://{your_APM_node}.pm.appneta.com/api/v3/
For example, say that the 'List observer URL' operation (or 'observer' endpoint, as it is named in the AppNeta API Docs) did not exist in our AppNeta Performance Manager connector, and you wanted to use it. You would use the AppNeta Performance Manager API docs to find that the 'observer' endpoint, and note that it is a GET request at the following URL:

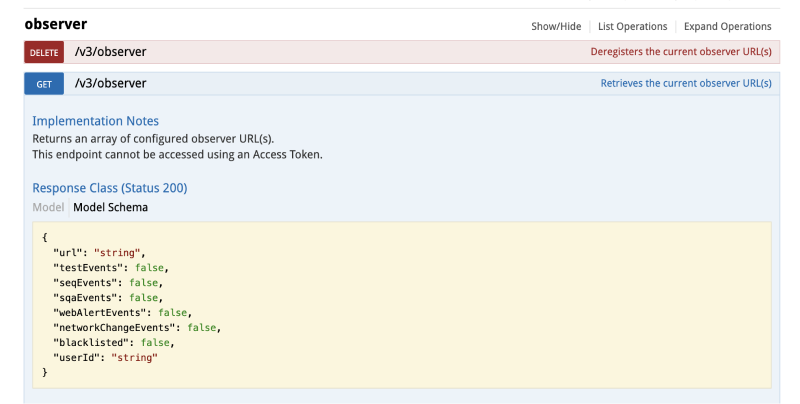
Method:
GETList observer URL:
/observer
So if you know what your endpoint is, you can get the observer URL, with the following settings:

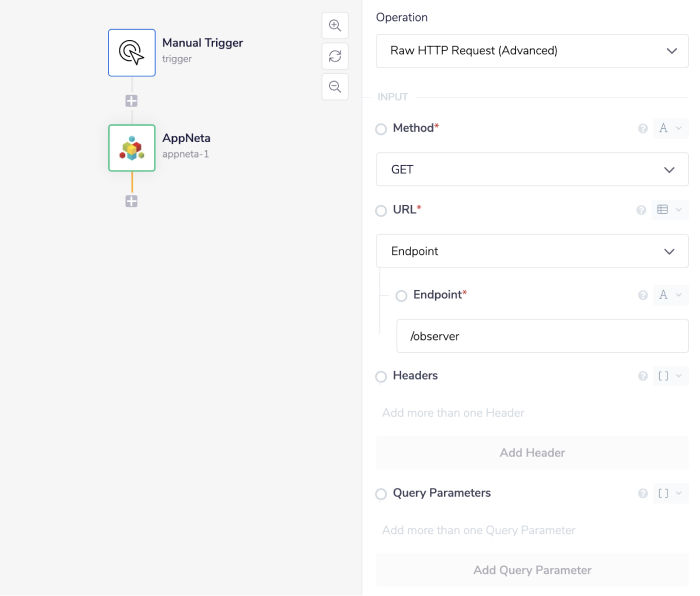
Final outcome being: https://{your_APM_node}.pm.appneta.com/api/v3/observer/
As a result, this will return the observer URL details as requested.
Example usageCopy
TRAY POTENTIAL: Tray.io is extremely flexible. By design there is no fixed way of working with it - you can pull whatever data you need from other services and work with it using our core and helper connectors. This demo which follows shows only one possible way of working with Tray.io and the AppNeta connector. Once you've finished working through this example please see our Introduction to working with data and jsonpaths page and Data Guide for more details.
Below is a brief example which demonstrates how to register, list and finally remove an observer URL within your AppNeta Performance Manager app.
The steps will be as follows:
Set up your manual trigger and first AppNeta connector step to register any observer URLs.
Add two more AppNeta connectors in order to display the new list, and then remove the observer URLs found.
EXTRA STEP: Double check the URL list has been removed.
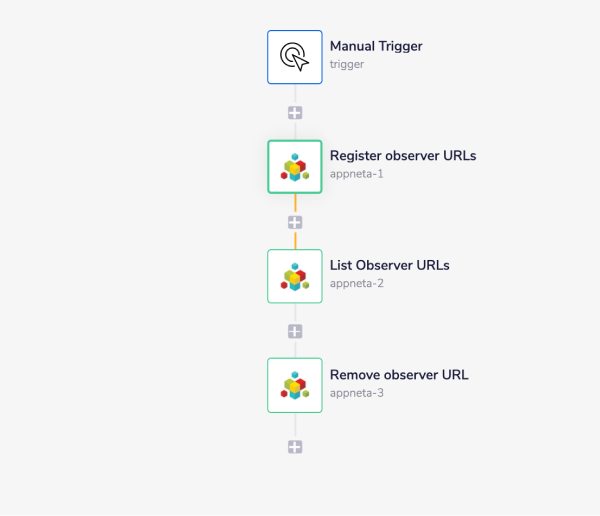
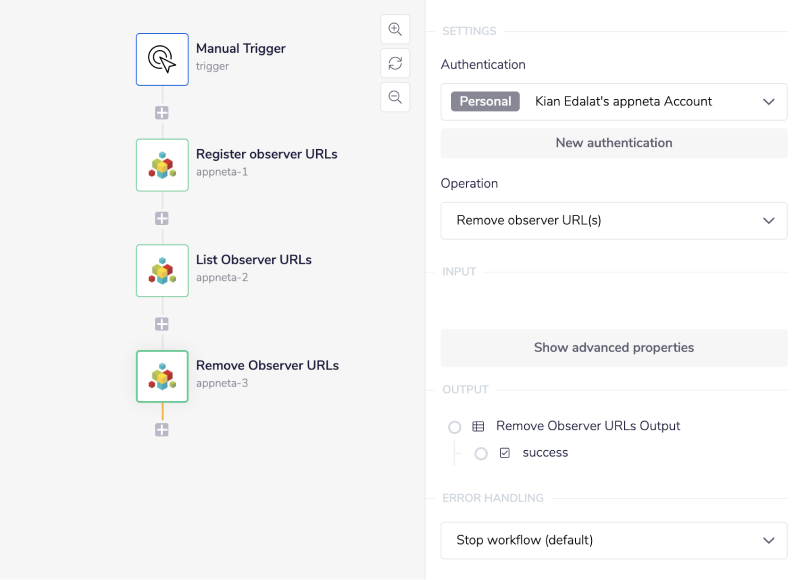
The final workflow will look like this:

1 - Setup trigger & Register observer URL(s)Copy
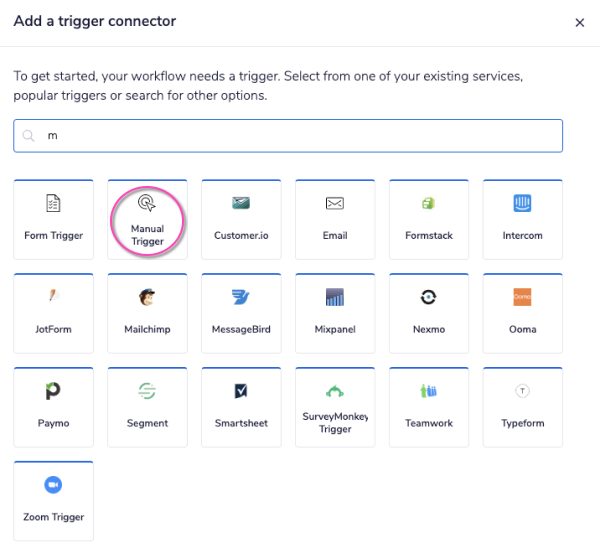
Once you have clicked 'Create new workflow' on your main Tray.io dashboard, select the 'Manual Trigger' from the trigger options available:

Once you have been redirected to your new Tray.io workflow dashboard, add an 'AppNeta' connector from the connectors panel on the left hand side of the builder. Set the operation to 'Register observer URL(s)'.
As you can see this operation requires users to add the 'Observers' field. This is a mandatory field and must be filled in.
Please feel free to re-name your steps as you go along to make things clearer for yourself and other users.

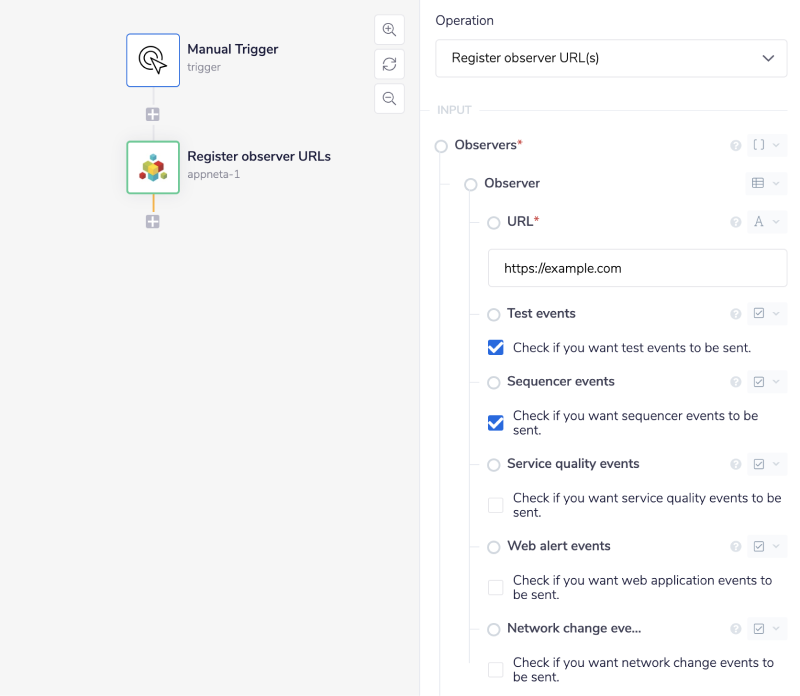
Click on the greyed out 'Add Observer' button. This generates the inputs necessary for this operation.
Please note that you will need to include either https:// or http:// for the URL field. For example: https://example.com
In order to send a request from this operation successfully you will also **need to add at least 1 test event to your observer. For this observer, we will check the 'Test events' and 'Sequencer events' options.
Further explanation of these test events can be found on the <Content type a TBD> .
For the sake of this example, create second observer with the options 'Service quality events' and 'Web alert events' selected instead. Again this can be done through clicking the greyed out 'Add Observer' button.

2 - Add List and Remove observer URL(s)Copy
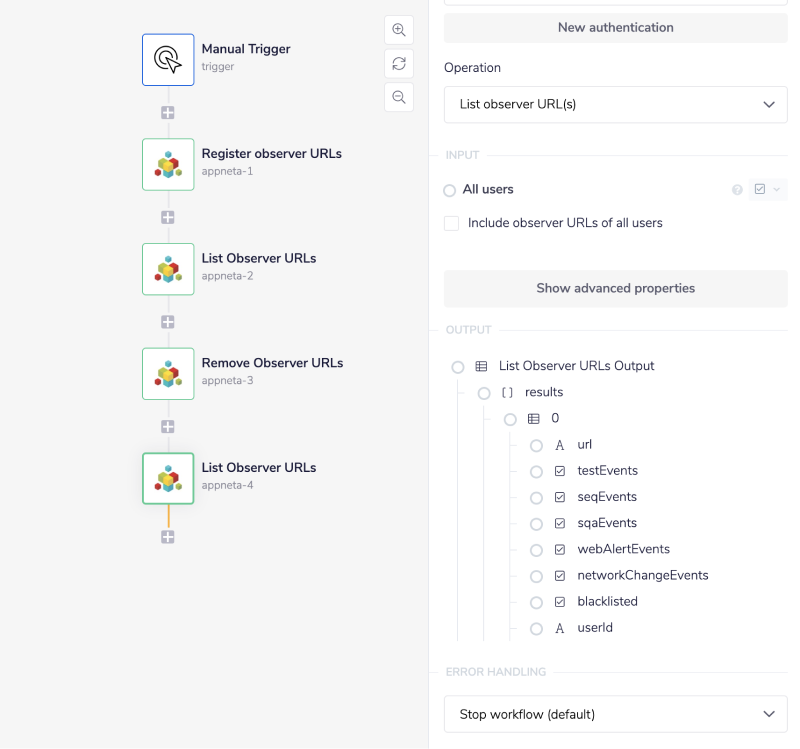
Add another AppNeta Performance Manager connector to the workflow. Set the operation to 'List Observer URLs'.
The requirements for this operation is minimal so there are no other steps needed. You can now press 'Run Workflow', and note that in order to see the output of your workflow you can check it within the Debug panels.
The same simplicity goes for the third and final AppNeta Performance Manager connector. This time set the operation to 'Remove Observer URLs'.
Make sure you add the correct operation to each connector and that the order is correct. If you add "Remove" before "List", then you wont receive any data in the final step!.

Extra Step - Double CheckCopy
To make sure your observer URLs has been removed, you can add an extra 'List Observer URLs' operation/ connector to your workflow, and expect and empty object from it.

Following the steps above, navigate to the Debug panels and investigate the Input and Output received from the AppNeta Performance Manager workflow steps:

BEST PRACTICES: Whenever you do decide to create your own workflow, be sure to check out some of our key articles such as: